实际模式

模式是通过价格在图表中形成的图形模型。 根据其中一项技术分析规定,历史(价格变动)重演。 这意味着价格变动在相同的情况下通常是相似的,这使得有可能以高概率预测情况的进一步发展。
InstaTrade的相关模式是一款易于使用的服务,可让您了解市场的最新变化并及时对市场线索做出反应。 在我们的服务中,您始终可以在任何货币对以及任何时间范围内找到最新和最相关的模式。
Bearish pennant
was formed on 31.03 at 16:00:21 (UTC+0)
signal strength 1 of 5

The Bearish pennant pattern has formed on the #AMZN M5 chart. It signals potential continuation of the existing trend. Specifications: the pattern’s bottom has the coordinate of 184.25; the projection of the flagpole height is equal to 866 pips. In case the price breaks out the pattern’s bottom of 184.25, the downtrend is expected to continue for further level 184.10.
The M5 and M15 time frames may have more false entry points.
See Also
- All
- All
- Bearish Rectangle
- Bearish Symmetrical Triangle
- Bearish Symmetrical Triangle
- Bullish Rectangle
- Double Top
- Double Top
- Triple Bottom
- Triple Bottom
- Triple Top
- Triple Top
- All
- All
- Buy
- Sale
- All
- 1
- 2
- 3
- 4
- 5
Bullish Rectangle
was formed on 14.04 at 04:08:09 (UTC+0)
signal strength 2 of 5
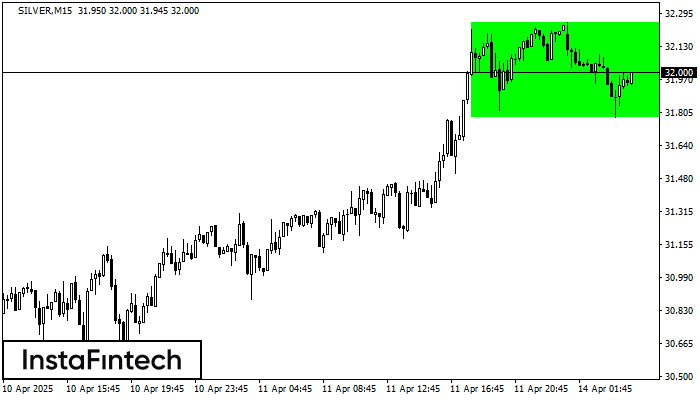
According to the chart of M15, SILVER formed the Bullish Rectangle. This type of a pattern indicates a trend continuation. It consists of two levels: resistance 32.25 and support 31.78
The M5 and M15 time frames may have more false entry points.
Open chart in a new window
Bullish Symmetrical Triangle
was formed on 14.04 at 04:00:58 (UTC+0)
signal strength 4 of 5

According to the chart of H1, EURNZD formed the Bullish Symmetrical Triangle pattern. Description: This is the pattern of a trend continuation. 2.0005 and 1.9118 are the coordinates
Open chart in a new window
Bullish Rectangle
was formed on 14.04 at 03:32:18 (UTC+0)
signal strength 1 of 5
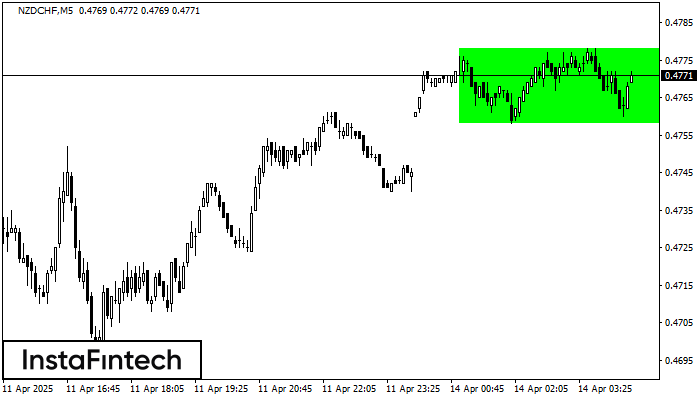
According to the chart of M5, NZDCHF formed the Bullish Rectangle. The pattern indicates a trend continuation. The upper border is 0.4778, the lower border is 0.4758. The signal means
The M5 and M15 time frames may have more false entry points.
Open chart in a new window