实际模式

模式是通过价格在图表中形成的图形模型。 根据其中一项技术分析规定,历史(价格变动)重演。 这意味着价格变动在相同的情况下通常是相似的,这使得有可能以高概率预测情况的进一步发展。
InstaTrade的相关模式是一款易于使用的服务,可让您了解市场的最新变化并及时对市场线索做出反应。 在我们的服务中,您始终可以在任何货币对以及任何时间范围内找到最新和最相关的模式。
Actual Patterns
- All
- All
- Bearish Rectangle
- Bearish Symmetrical Triangle
- Bearish Symmetrical Triangle
- Bullish Rectangle
- Double Top
- Double Top
- Triple Bottom
- Triple Bottom
- Triple Top
- Triple Top
- All
- All
- Buy
- Sale
- All
- 1
- 2
- 3
- 4
- 5
Bearish pennant
сформирован 16.04 в 16:00:14 (UTC+0)
сила сигнала 1 из 5
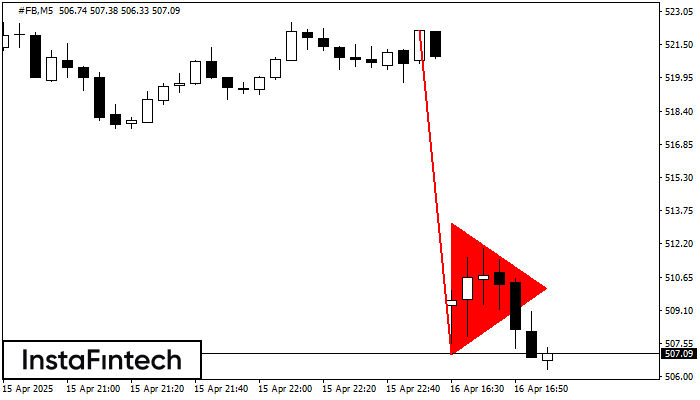
The Bearish pennant pattern has formed on the #FB M5 chart. The pattern signals continuation of the downtrend in case the pennant’s low of 507.03 is broken through. Recommendations: Place
The M5 and M15 time frames may have more false entry points.
Открыть график инструмента в новом окне
Bearish Rectangle
сформирован 16.04 в 15:55:38 (UTC+0)
сила сигнала 1 из 5
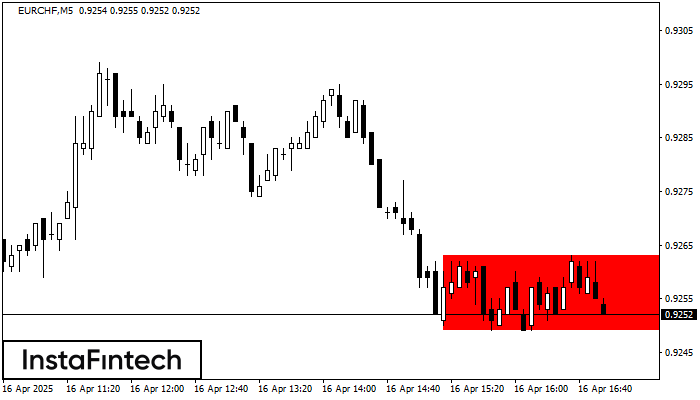
According to the chart of M5, EURCHF formed the Bearish Rectangle. This type of a pattern indicates a trend continuation. It consists of two levels: resistance 0.9263 - 0.0000
The M5 and M15 time frames may have more false entry points.
Открыть график инструмента в новом окне
Head and Shoulders
сформирован 16.04 в 15:30:49 (UTC+0)
сила сигнала 2 из 5
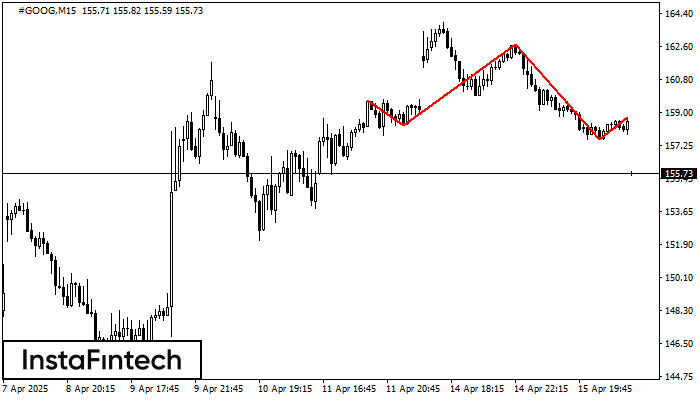
According to the chart of M15, #GOOG formed the Head and Shoulders pattern. The Head’s top is set at 162.70 while the median line of the Neck is found
The M5 and M15 time frames may have more false entry points.
Открыть график инструмента в новом окне
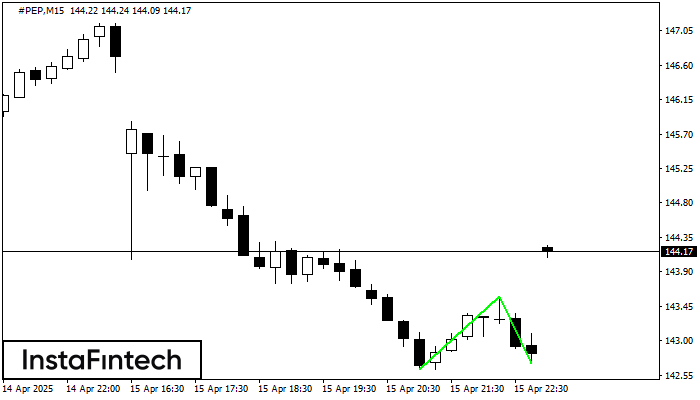
Double Bottom
сформирован 16.04 в 15:30:39 (UTC+0)
сила сигнала 2 из 5

The Double Bottom pattern has been formed on #PEP M15; the upper boundary is 143.58; the lower boundary is 142.70. The width of the pattern is 96 points. In case
The M5 and M15 time frames may have more false entry points.
Открыть график инструмента в новом окне
Double Bottom
сформирован 16.04 в 15:30:27 (UTC+0)
сила сигнала 2 из 5
The Double Bottom pattern has been formed on #PEP M15. Characteristics: the support level 142.62; the resistance level 143.58; the width of the pattern 96 points. If the resistance level
The M5 and M15 time frames may have more false entry points.
Открыть график инструмента в новом окне
Head and Shoulders
сформирован 16.04 в 15:00:08 (UTC+0)
сила сигнала 2 из 5
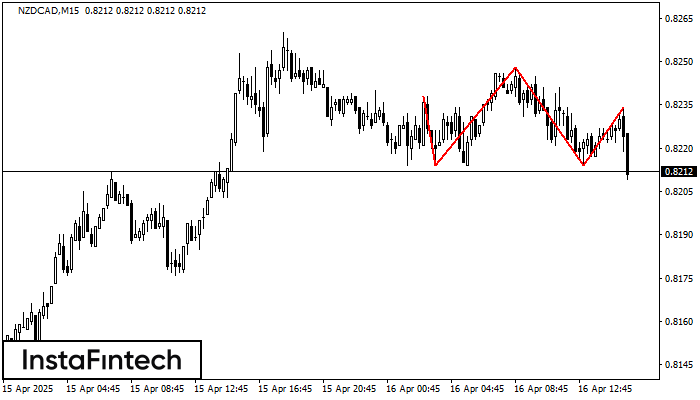
The NZDCAD M15 formed the Head and Shoulders pattern with the following features: The Head’s top is at 0.8248, the Neckline and the upward angle are at 0.8214/0.8214. The formation
The M5 and M15 time frames may have more false entry points.
Открыть график инструмента в новом окне
Bullish Rectangle
сформирован 16.04 в 14:30:25 (UTC+0)
сила сигнала 2 из 5
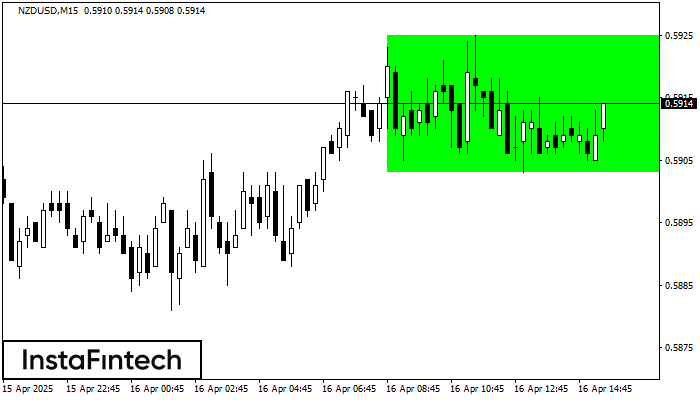
According to the chart of M15, NZDUSD formed the Bullish Rectangle which is a pattern of a trend continuation. The pattern is contained within the following borders: the lower border
The M5 and M15 time frames may have more false entry points.
Открыть график инструмента в новом окне
Bearish Rectangle
сформирован 16.04 в 14:05:33 (UTC+0)
сила сигнала 1 из 5
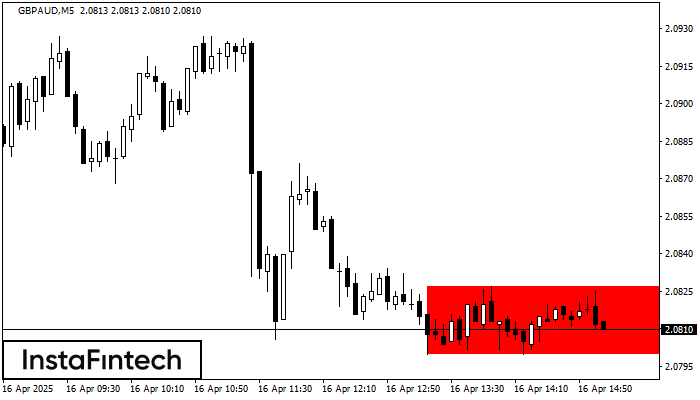
According to the chart of M5, GBPAUD formed the Bearish Rectangle. This type of a pattern indicates a trend continuation. It consists of two levels: resistance 2.0827 - 0.0000
The M5 and M15 time frames may have more false entry points.
Открыть график инструмента в новом окне
Triple Top
сформирован 16.04 в 13:40:08 (UTC+0)
сила сигнала 1 из 5
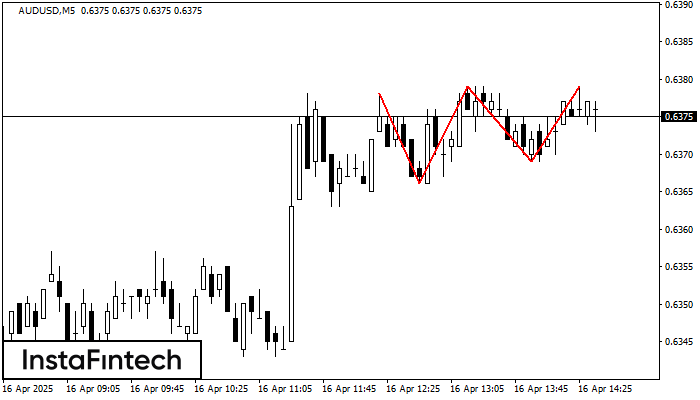
On the chart of the AUDUSD M5 trading instrument, the Triple Top pattern that signals a trend change has formed. It is possible that after formation of the third peak
The M5 and M15 time frames may have more false entry points.
Открыть график инструмента в новом окне