Actual patterns

Patterns are graphical models which are formed in the chart by the price. According to one of the technical analysis postulates, history (price movement) repeats itself. It means that the price movements are often similar in the same situations which makes it possible to predict the further development of the situation with a high probability.
Relevant patterns by InstaTrade is an easy-to-use service which allows you to be aware of latest changes in the market and react to clues from the market in time. In our service you will always find the latest and most relevant patterns on any pair and any timeframe.
Bearish Rectangle
was formed on 27.03 at 06:07:54 (UTC+0)
signal strength 1 of 5

According to the chart of M5, USDJPY formed the Bearish Rectangle. The pattern indicates a trend continuation. The upper border is 150.29, the lower border is 150.10. The signal means that a short position should be opened after fixing a price below the lower border 150.10 of the Bearish Rectangle.
The M5 and M15 time frames may have more false entry points.
See Also
- All
- All
- Bearish Rectangle
- Bearish Symmetrical Triangle
- Bearish Symmetrical Triangle
- Bullish Rectangle
- Double Top
- Double Top
- Triple Bottom
- Triple Bottom
- Triple Top
- Triple Top
- All
- All
- Buy
- Sale
- All
- 1
- 2
- 3
- 4
- 5
Triple Bottom
was formed on 10.04 at 19:05:09 (UTC+0)
signal strength 1 of 5
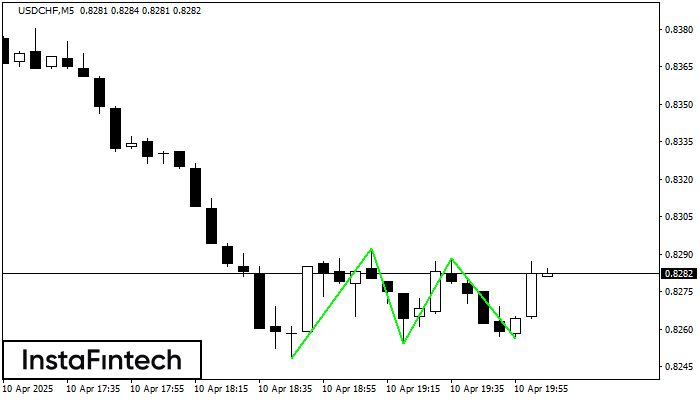
The Triple Bottom pattern has been formed on USDCHF M5. It has the following characteristics: resistance level 0.8292/0.8288; support level 0.8248/0.8256; the width is 44 points. In the event
The M5 and M15 time frames may have more false entry points.
Open chart in a new window
Triple Bottom
was formed on 10.04 at 19:00:20 (UTC+0)
signal strength 4 of 5
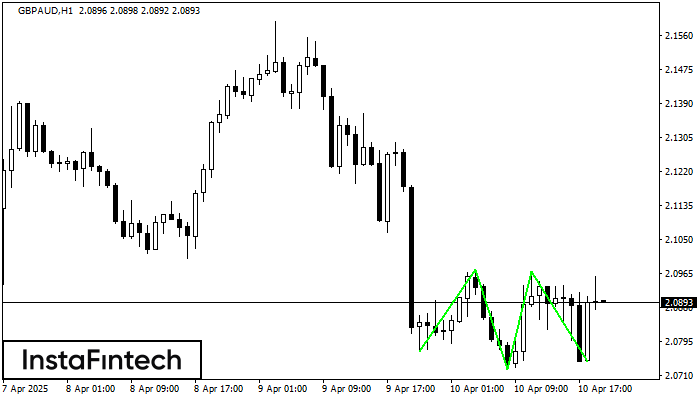
The Triple Bottom pattern has been formed on GBPAUD H1. It has the following characteristics: resistance level 2.0974/2.0969; support level 2.0768/2.0744; the width is 206 points. In the event
Open chart in a new window
Bearish Symmetrical Triangle
was formed on 10.04 at 18:50:38 (UTC+0)
signal strength 1 of 5
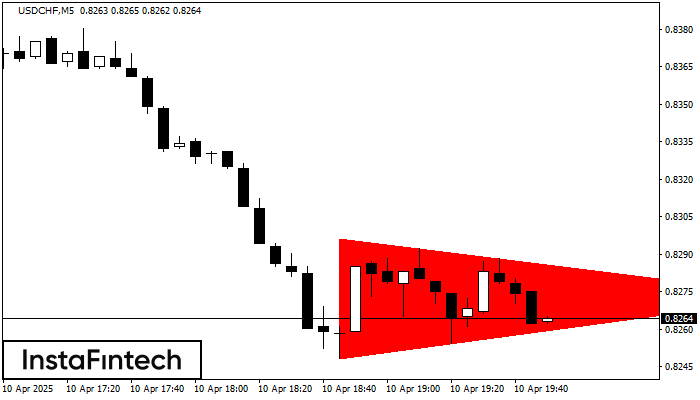
According to the chart of M5, USDCHF formed the Bearish Symmetrical Triangle pattern. Description: The lower border is 0.8248/0.8273 and upper border is 0.8296/0.8273. The pattern width is measured
The M5 and M15 time frames may have more false entry points.
Open chart in a new window