অ্যাকচুয়াল প্যাটার্নস

প্যাটার্ন হলো গ্রাফিক্যাল মডেল, যা মূল্য ওঠানামার ভিত্তিতে চার্টে তৈরি হয়। টেকনিক্যাল বিশ্লেষণের নীতি অনুযায়ী, ইতিহাসের (প্রাইস মুভমেন্ট) পুনরাবৃত্তি ঘটে। অর্থাৎ, পরিস্থিতি যদি একই রকম থাকে তাহলে প্রাইস মুভমেন্টও প্রায় একই রকম হয়। এর ফলে মূল্যের ওঠানামা কেমন হবে তা আগেই থেকেই অনুমান করা যায়।
ইন্সটাফরেক্স এর প্রাসঙ্গিক প্যাটার্নসমূহ সহজেই ব্যবহার করা যায়, যার মাধ্যমে মার্কেটের সর্বশেষ পরিস্থিতি জানা যায় এবং তার উপর ভিত্তি করে সিদ্ধান্ত নেওয়া যায়। আমাদের সেবাগুলো থেকে আপনি যেকোনো পেয়ার এবং টাইমফ্রেমের জন্য সর্বশেষ এবং সবচেয়ে প্রাসঙ্গিক প্যাটার্নগুলো খুঁজে পাবেন।
Triple Top
was formed on 31.03 at 15:15:11 (UTC+0)
signal strength 2 of 5

The Triple Top pattern has formed on the chart of the GOLD M15. Features of the pattern: borders have an ascending angle; the lower line of the pattern has the coordinates 3111.43/3112.94 with the upper limit 3127.49/3126.34; the projection of the width is 1606 points. The formation of the Triple Top figure most likely indicates a change in the trend from upward to downward. This means that in the event of a breakdown of the support level of 3111.43, the price is most likely to continue the downward movement.
The M5 and M15 time frames may have more false entry points.
আরও দেখুন
- All
- All
- Bearish Rectangle
- Bearish Symmetrical Triangle
- Bearish Symmetrical Triangle
- Bullish Rectangle
- Double Top
- Double Top
- Triple Bottom
- Triple Bottom
- Triple Top
- Triple Top
- All
- All
- Buy
- Sale
- All
- 1
- 2
- 3
- 4
- 5
Double Bottom
was formed on 07.04 at 11:00:00 (UTC+0)
signal strength 3 of 5
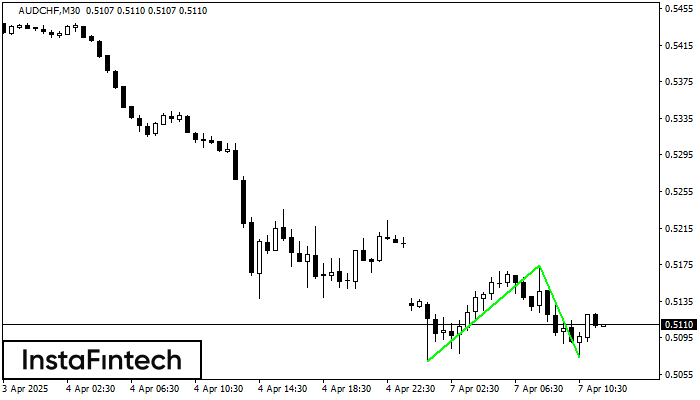
The Double Bottom pattern has been formed on AUDCHF M30. Characteristics: the support level 0.5069; the resistance level 0.5174; the width of the pattern 105 points. If the resistance level
Open chart in a new window
Head and Shoulders
was formed on 07.04 at 10:35:00 (UTC+0)
signal strength 1 of 5

The EURCAD M5 formed the Head and Shoulders pattern with the following features: The Head’s top is at 1.5734, the Neckline and the upward angle are at 1.5652/1.5644. The formation
The M5 and M15 time frames may have more false entry points.
Open chart in a new window
Double Bottom
was formed on 07.04 at 10:29:41 (UTC+0)
signal strength 3 of 5
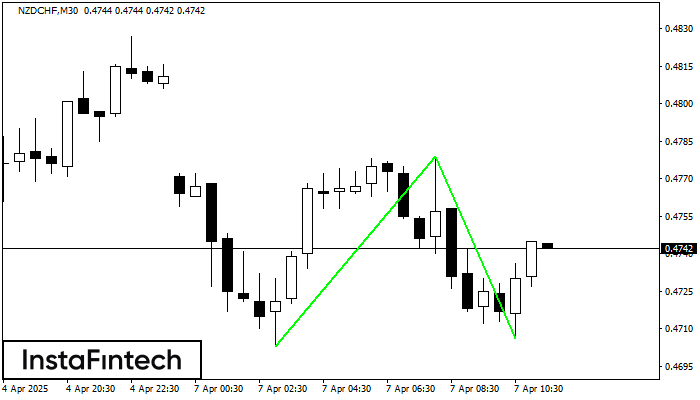
The Double Bottom pattern has been formed on NZDCHF M30. This formation signals a reversal of the trend from downwards to upwards. The signal is that a buy trade should
Open chart in a new window