Double Bottom
was formed on 29.03 at 11:00:31 (UTC+0)
signal strength 3 of 5
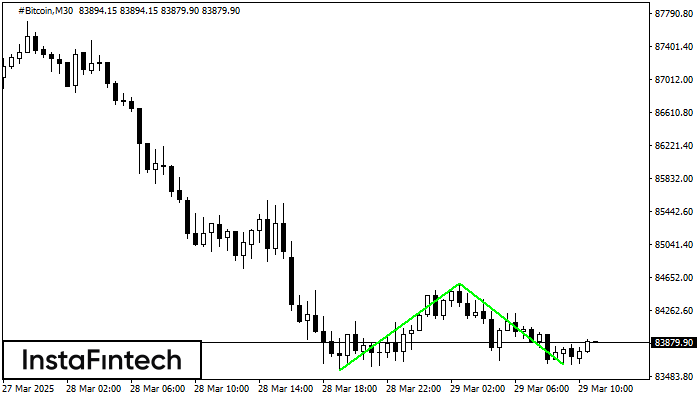
The Double Bottom pattern has been formed on #Bitcoin M30. Characteristics: the support level 83552.05; the resistance level 84588.82; the width of the pattern 103677 points. If the resistance level is broken, a change in the trend can be predicted with the first target point lying at the distance of 96966 points.
আরও দেখুন
- All
- All
- Bearish Rectangle
- Bearish Symmetrical Triangle
- Bullish Rectangle
- Double Top
- Double Top
- Triple Bottom
- Triple Bottom
- Triple Top
- Triple Top
- All
- All
- Buy
- Sale
- All
- 1
- 2
- 3
- 4
- 5
ডাবল টপ
was formed on 02.04 at 01:30:23 (UTC+0)
signal strength 3 of 5
M30 চার্টে, #Bitcoin-এর ডাবল টপ প্যাটার্নটি গঠিত হয়েছে। এটি এই ইঙ্গিত দেয় যে চলমান প্রবণতা ঊর্ধ্বমুখী থেকে নিম্নমুখীতে পরিবর্তিত হয়েছে। সম্ভবত, যদি 84666.85 প্যাটার্নের ভিত্তিটি ব্রেক করা হয়, তাহলে নিম্নমুখী
Open chart in a new window
ডাবল বটম
was formed on 02.04 at 00:00:26 (UTC+0)
signal strength 3 of 5
M30 চার্টে, GBPAUD-এর ডাবল বটম প্যাটার্নটি গঠিত হয়েছে। উপরের সীমানা হল 2.0616; নীচের সীমানা হল 2.0566। প্যাটার্নের প্রস্থ হল 47 পয়েন্ট। 2.0616-এর উপরের সীমানা ভেদ করার ক্ষেত্রে, প্রবণতা পরিবর্তনের পূর্বাভাস
Open chart in a new window
বুলিশ ফ্ল্যাগ
was formed on 01.04 at 22:25:56 (UTC+0)
signal strength 1 of 5
M5 চার্টে AUDCHF-এর বুলিশ ফ্ল্যাগ প্যাটার্ন গঠিত হয়েছে যা এই ইঙ্গিত দেয় যে ঊর্ধ্বমুখী প্রবণতা অব্যাহত থাকবে৷ সংকেত: 0.5551 -এর শীর্ষস্তর ভেদ করা হলে মূল্য আরও উপরের দিকে উঠতে পারে
M5 এবং M15 টাইম ফ্রেমে আরও ভুল এন্ট্রি পয়েন্ট থাকতে পারে।
Open chart in a new window