empty
22.01.2025 03:25 PM
GBP/USD: Trading Plan for the U.S. Session on January 22nd (Review of Morning Trades)

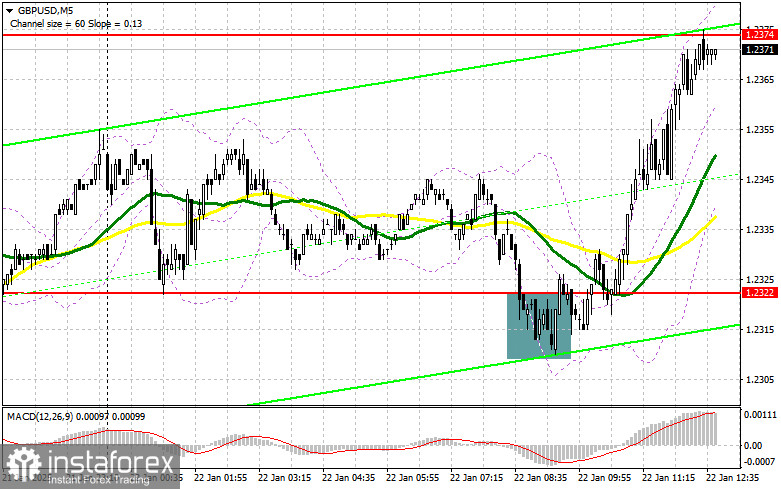
In my morning forecast, I highlighted the 1.2322 level and planned to make market entry decisions around it. Let's review the 5-minute chart and analyze what happened. The decline and formation of a false breakout near 1.2322 led to a buying opportunity for the pound, ultimately resulting in its rise toward the target level of 1.2374, delivering over 50 points in profit. The technical outlook for the second half of the day has been revised.

This image is no longer relevant

To Open Long Positions on GBP/USD

A significant increase in UK public sector borrowing and optimism surrounding Trump's measured approach in the first days of his presidency continue to support the pound and pressure the US dollar. In the afternoon, only data on the US Leading Indicators Index is scheduled, which could spark a new wave of pound growth.

If the pair declines, I plan to buy only after forming a false breakout near the nearest support at 1.2322, similar to the earlier scenario. The target will be a recovery of GBP/USD toward the 1.2374 resistance level. A breakout and retest from above of this range would create a new entry point for long positions, aiming for a move to 1.2412, which would further solidify the bullish trend. The ultimate target will be the 1.2449 level, where I will lock in profits. If GBP/USD declines and shows no bullish activity at 1.2322, the pound could erase its morning gains. In this case, only a false breakout near the 1.2271 level would provide an appropriate condition for opening long positions. I plan to buy GBP/USD immediately on a rebound from 1.2231, targeting an intraday correction of 30–35 points.

To Open Short Positions on GBP/USD

Sellers made attempts during the first half of the day, but with limited success. Now it is crucial to maintain control of the nearest resistance at 1.2374, which has already been tested. The lack of active downward movement from this level is concerning.

Only forming a false breakout at 1.2374 after US data could create a selling opportunity, aiming for a drop toward 1.2322, below which the moving averages favor bulls. A breakout and retest from below of this range would trigger stop-loss orders, opening the path to 1.2271, signaling the halting of the bullish market. The ultimate target will be the 1.2231 level, where I plan to lock in profits. If demand for the pound persists in the second half of the day and bears fail to act at 1.2374, it's better to postpone short positions until testing the 1.2412 resistance. I'll only sell there after a failed consolidation. If no downward movement occurs there, I'll look for short positions on a rebound from 1.2449, targeting an intraday correction of 30–35 points.

This image is no longer relevant

Commitment of Traders (COT) Report

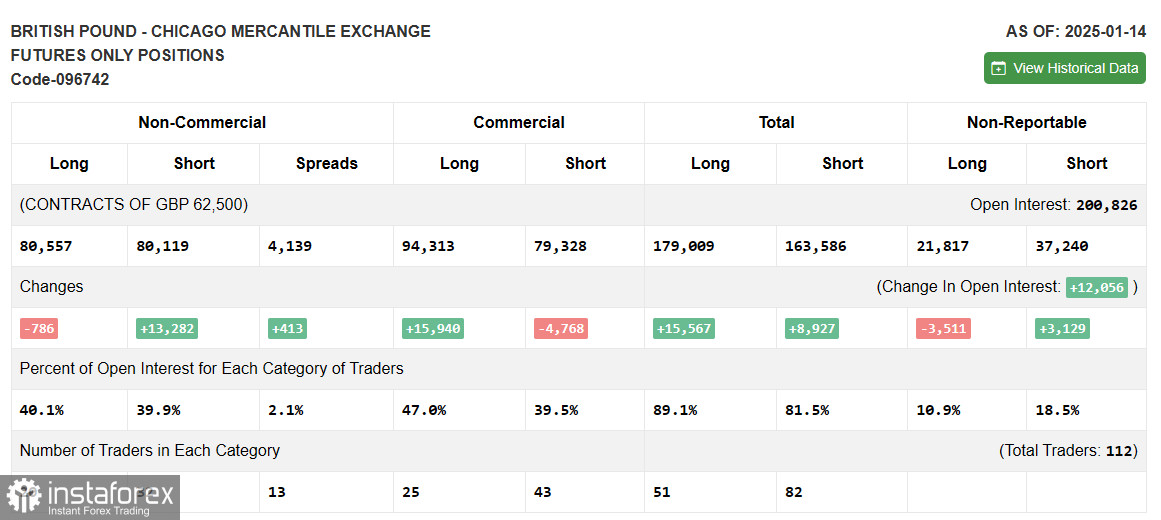
The January 14 COT report indicated a sharp increase in short positions and a reduction in long positions. The balance of power has shifted significantly, signaling a market at a turning point. With nearly equal numbers of buyers and sellers, the outlook is not in favor of bulls. In the near future, labor market data is expected, and following weak UK GDP growth and high inflation, the Bank of England's next decision seems less predictable. Whether the regulator will lower interest rates amidst the observed issues remains a complex question. The latest COT report noted that long non-commercial positions fell by 786 to 80,557, while short non-commercial positions increased by 13,282 to 80,119, resulting in the gap between long and short positions widening by 413.

This image is no longer relevant

Indicator Signals

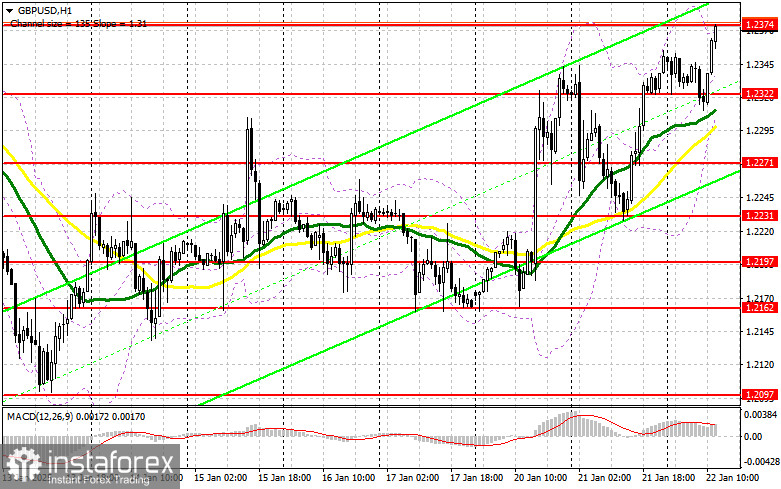
Moving AveragesTrading occurs above the 30- and 50-day moving averages, indicating further growth for the pair.Note: The author analyzes the moving averages on the hourly H1 chart, differing from the classical definition on the daily D1 chart.

Bollinger BandsIn the event of a decline, the lower boundary of the indicator near 1.2320 will act as support.

Indicator Descriptions

  • Moving Average: Determines the current trend by smoothing volatility and noise. Periods: 50 (yellow), 30 (green).
  • MACD: Moving Average Convergence/Divergence. Fast EMA – Period: 12, Slow EMA – Period: 26, SMA – Period: 9.
  • Bollinger Bands: Tracks price volatility. Period: 20.
  • Non-Commercial Traders: Speculators like individual traders, hedge funds, and large institutions using the futures market for speculative purposes.
  • Long Non-Commercial Positions: Total long positions held by non-commercial traders.
  • Short Non-Commercial Positions: Total short positions held by non-commercial traders.
  • Net Non-Commercial Position: The difference between short and long positions held by non-commercial traders.

Recommended Stories

১১ এপ্রিল কীভাবে GBP/USD পেয়ারের ট্রেডিং করবেন? নতুন ট্রেডারদের জন্য সহজ পরামর্শ ও ট্রেডিংয়ের বিশ্লেষণ

বৃহস্পতিবারের ট্রেডের বিশ্লেষণ GBP/USD পেয়ারের 1H চার্ট গত ২৪ ঘণ্টায় GBP/USD পেয়ারের মূল্য 170 পিপস পর্যন্ত বৃদ্ধি পেয়েছে। বৃহস্পতিবার রাত থেকে শুক্রবার সকাল পর্যন্ত পাউন্ড স্টার্লিংয়ের মূল্যের ঊর্ধ্বমুখী মুভমেন্ট অব্যাহত

Paolo Greco 08:13 2025-04-11 UTC+2

১১ এপ্রিল কীভাবে EUR/USD পেয়ারের ট্রেডিং করবেন? নতুন ট্রেডারদের জন্য সহজ পরামর্শ ও ট্রেডিংয়ের বিশ্লেষণ

বৃহস্পতিবারের ট্রেডের বিশ্লেষণ EUR/USD পেয়ারের 1H চার্ট বৃহস্পতিবার পুনরায় EUR/USD কারেন্সি পেয়ারের মূল্যের ঊর্ধ্বমুখী মুভমেন্ট শুরু হয় এবং এটির মূল্য 300 পিপসের বেশি বৃদ্ধি পায়। শুক্রবারের শুরুর দিকেও এই পেয়ারের

Paolo Greco 07:57 2025-04-11 UTC+2

১০ এপ্রিল কীভাবে GBP/USD পেয়ারের ট্রেডিং করবেন? নতুন ট্রেডারদের জন্য সহজ পরামর্শ ও ট্রেডিংয়ের বিশ্লেষণ

বুধবারের ট্রেডের বিশ্লেষণ GBP/USD পেয়ারের 1H চার্ট গত ২৪ ঘণ্টায় GBP/USD পেয়ারের মূল্য একবার ঊর্ধ্বমুখী, তারপর নিম্নমুখী, তারপর আবার ঊর্ধ্বমুখী হয়েছে। আগের মতোই, ১ ঘণ্টার টাইমফ্রেমে কোনো স্পষ্ট প্রবণতা চিহ্নিত

Paolo Greco 08:50 2025-04-10 UTC+2

১০ এপ্রিল কীভাবে EUR/USD পেয়ারের ট্রেডিং করবেন? নতুন ট্রেডারদের জন্য সহজ পরামর্শ ও ট্রেডিংয়ের বিশ্লেষণ

বুধবারের ট্রেডের বিশ্লেষণ EUR/USD পেয়ারের 1H চার্ট বুধবার EUR/USD পেয়ারের মূল্যের শক্তিশালী ঊর্ধ্বমুখী ও নিম্নমুখী প্রবণতা পরিলক্ষিত হয়েছে। সাম্প্রতিক সময়ে এই দুই ধরনের মুভমেন্টেরই প্রধান কারণ হচ্ছে ডোনাল্ড ট্রাম্পের গৃহীত

Paolo Greco 08:17 2025-04-10 UTC+2

৯ এপ্রিল কীভাবে GBP/USD পেয়ারের ট্রেডিং করবেন? নতুন ট্রেডারদের জন্য সহজ পরামর্শ ও ট্রেডিংয়ের বিশ্লেষণ

মঙ্গলবারের ট্রেডের বিশ্লেষণ GBP/USD পেয়ারের 1H চার্ট মঙ্গলবার GBP/USD পেয়ারের মূল্যের সামান্য ঊর্ধ্বমুখী প্রবণতা দেখা গেছে। সারাদিন ধরে কোনো গুরুত্বপূর্ণ সংবাদ প্রকাশিত হয়নি, তবে সন্ধ্যায় চীনের ওপর শুল্ক বৃদ্ধির ঘোষণা

Paolo Greco 08:53 2025-04-09 UTC+2

৯ এপ্রিল কীভাবে EUR/USD পেয়ারের ট্রেডিং করবেন? নতুন ট্রেডারদের জন্য সহজ পরামর্শ ও ট্রেডিংয়ের বিশ্লেষণ

মঙ্গলবারের ট্রেডের বিশ্লেষণ EUR/USD পেয়ারের 1H চার্ট মঙ্গলবার খুবই স্বল্প মাত্রার অস্থিরতার সাথে EUR/USD কারেন্সি পেয়ারের মূল্যের মুভমেন্ট পরিলক্ষিত হয়েছে এবং সারাদিন জুড়ে এটি মূলত সাইডওয়েজ ট্রেড করেছে। তবে, আমরা

Paolo Greco 08:23 2025-04-09 UTC+2

৮ এপ্রিল কীভাবে GBP/USD পেয়ারের ট্রেডিং করবেন? নতুন ট্রেডারদের জন্য সহজ পরামর্শ ও ট্রেডিংয়ের বিশ্লেষণ

সোমবারের ট্রেডের বিশ্লেষণ GBP/USD পেয়ারের 1H চার্ট সোমবার GBP/USD পেয়ারের উল্লেখযোগ্য দরপতন হয়েছে। যে পাউন্ড দীর্ঘ সময় ধরে ডলারের বিপরীতে স্থিরভাবে শক্তিশালী হচ্ছিল, হঠাৎ করে কেন এত বড় দরপতনের শিকার

Paolo Greco 08:56 2025-04-08 UTC+2

৮ এপ্রিল কীভাবে EUR/USD পেয়ারের ট্রেডিং করবেন? নতুন ট্রেডারদের জন্য সহজ পরামর্শ ও ট্রেডিংয়ের বিশ্লেষণ

সোমবারের ট্রেডের বিশ্লেষণ EUR/USD পেয়ারের 1H চার্ট সোমবার EUR/USD কারেন্সি পেয়ারের মূল্যের তীব্র ওঠানামা দেখা গেছে। বর্তমান পরিস্থিতিকে বহুভাবে ব্যাখ্যা করা যায়—আতঙ্ক, বিশৃঙ্খলা, উন্মত্ততা, কিংবা প্রলয়। কিন্তু মূল সমস্যা একটাই

Paolo Greco 08:04 2025-04-08 UTC+2

৭ এপ্রিল কীভাবে GBP/USD পেয়ারের ট্রেডিং করবেন? নতুন ট্রেডারদের জন্য সহজ পরামর্শ ও ট্রেডিংয়ের বিশ্লেষণ

শুক্রবারের ট্রেডের বিশ্লেষণ GBP/USD পেয়ারের 1H চার্ট শুক্রবার GBP/USD পেয়ারের তীব্র দরপতন পরিলক্ষিত হয়েছে, যার কারণ ব্যাখ্যা করা অত্যন্ত কঠিন। হ্যাঁ, ব্রিটিশ পাউন্ড বর্তমানে অতিরিক্ত ক্রয় করা হয়েছে এবং অযৌক্তিকভাবে

Paolo Greco 08:24 2025-04-07 UTC+2

৭ এপ্রিল কীভাবে EUR/USD পেয়ারের ট্রেডিং করবেন? নতুন ট্রেডারদের জন্য সহজ পরামর্শ ও ট্রেডিংয়ের বিশ্লেষণ

শুক্রবারের ট্রেডের বিশ্লেষণ EUR/USD পেয়ারের 1H চার্ট শুক্রবারও EUR/USD কারেন্সি পেয়ারের মূল্যের অস্থিরতা পরিলক্ষিত হয়েছে। এবার নিম্নমুখী মুভমেন্ট দেখা গেছে — তবে এতে পরিস্থিতি স্পষ্ট হয়নি। শুক্রবার যদি আমরা আবারও

Paolo Greco 08:10 2025-04-07 UTC+2
এখন কথা বলতে পারবেন না?
আপনার প্রশ্ন জিজ্ঞাসা করুন চ্যাট.
 

Dear visitor,

Your IP address shows that you are currently located in the USA. If you are a resident of the United States, you are prohibited from using the services of InstaFintech Group including online trading, online transfers, deposit/withdrawal of funds, etc.

If you think you are seeing this message by mistake and your location is not the US, kindly proceed to the website. Otherwise, you must leave the website in order to comply with government restrictions.

Why does your IP address show your location as the USA?

  • - you are using a VPN provided by a hosting company based in the United States;
  • - your IP does not have proper WHOIS records;
  • - an error occurred in the WHOIS geolocation database.

Please confirm whether you are a US resident or not by clicking the relevant button below. If you choose the wrong option, being a US resident, you will not be able to open an account with InstaTrade anyway.

We are sorry for any inconvenience caused by this message.