আরও দেখুন


 26.05.2022 02:01 PM
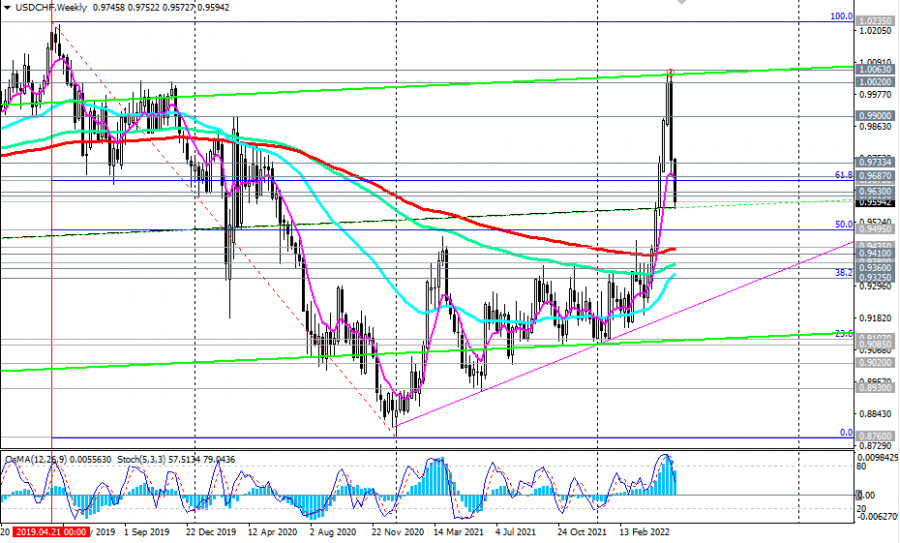
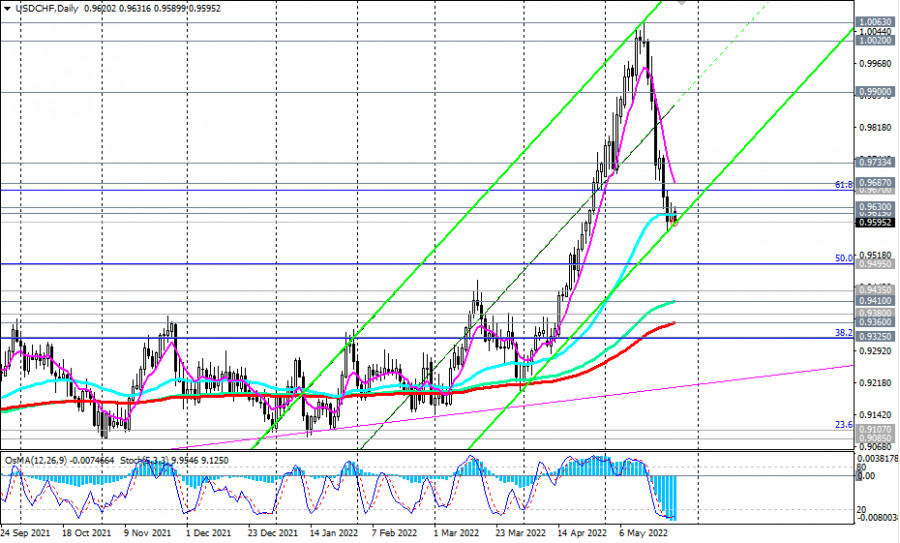
USD/CHF is trading near 0.9592 as of this writing, down from a nearly 2-week high at 1.0020.
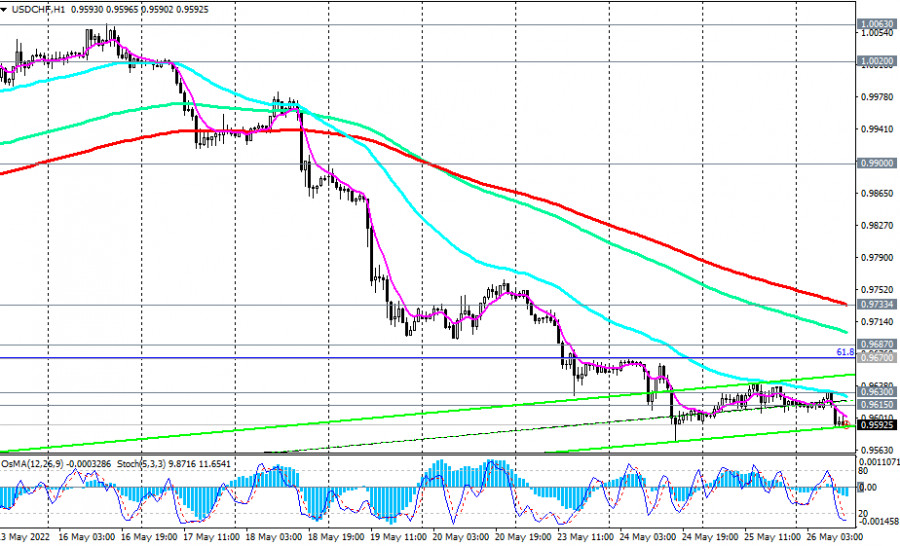
Despite the decline, the long-term upward trend of USD/CHF remains, while the pair reached important support levels at 0.9615 (50 EMA on the daily chart), and 0.9595 (the lower limit of the ascending channel on the daily chart), from which a rebound and resumption of growth is possible.
A strong upward impulse prevails, which is provided primarily by the prospects for further strengthening of the dollar against the backdrop of the Fed's monetary policy, the most aggressive in comparison with the policies of other major world central banks.
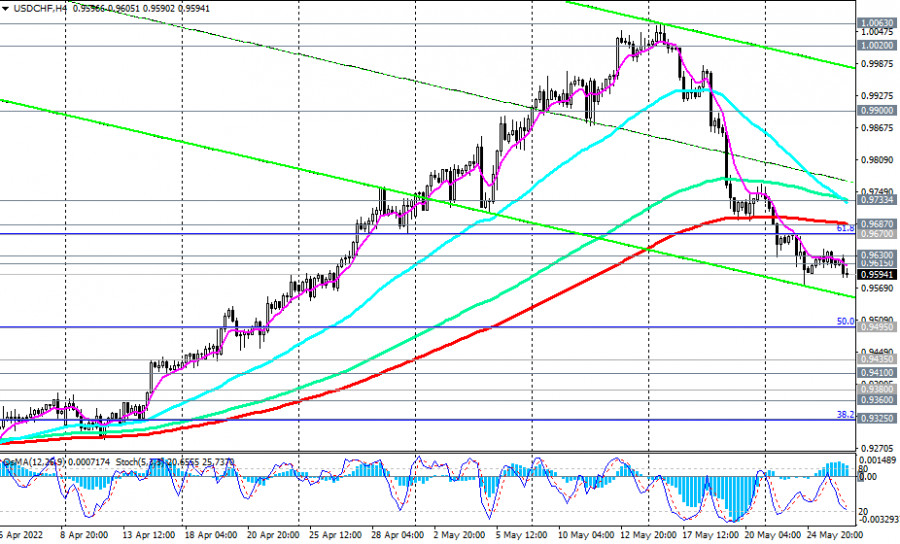
If, as we assumed, there is a rebound from the current support levels, then the first ("fast") signal for entering long positions will be a breakdown of the local resistance levels at 0.9630, 0.9642, and the confirming one will be a breakdown of the resistance levels at 0.9687 (200 EMA on the 4-hour chart), and 0.9733 (200 EMA on the 1-hour chart).
In an alternative scenario, and if the fundamental background still pushes the USD/CHF quotes lower, the downward correction may continue up to the support levels 0.9435 (200 EMA on the weekly chart), and 0.9410 (144 EMA on the daily chart).
A breakdown of support levels 0.9360 (200 EMA on the daily chart), and 0.9325 (38.2% Fibonacci retracement of the upward correction to the downward wave that began in April 2019 near 1.0235) may once again push USD/CHF into the bear market zone.
It should be noted that today's publication (at 12:30 GMT) of the report of the US Bureau of Economic Analysis with data on the country's GDP can become a new driver of movement.
Support levels: 0.9615, 0.9595, 0.9500, 0.9495, 0.9435, 0.9410, 0.9380, 0.9360, 0.9325, 0.9300
Resistance levels: 0.9630, 0.9642, 0.9670, 0.9687, 0.9733, 0.9900, 1.0000, 1.0020, 1.0063
Trading tips
Sell Stop – 0.9565. Stop-Loss – 0.9655. Take-Profit –0.9500, 0.9495, 0.9435, 0.9410, 0.9380, 0.9360, 0.9325, 0.9300
Buy Stop – 0.9655. Stop-Loss – 0.9565. Take-Profit – 0.9670, 0.9687, 0.9733, 0.9900, 1.0000, 1.0020, 1.0063
You have already liked this post today
*এখানে পোস্ট করা মার্কেট বিশ্লেষণ আপনার সচেতনতা বৃদ্ধির জন্য প্রদান করা হয়, ট্রেড করার নির্দেশনা প্রদানের জন্য প্রদান করা হয় না।
বৃহস্পতিবারের ট্রেডের বিশ্লেষণ GBP/USD পেয়ারের 1H চার্ট বৃহস্পতিবার ঊর্ধ্বমুখী প্রবণতার সাথে GBP/USD পেয়ারের ট্রেডিং অব্যাহত ছিল, যদিও এই ধরনের মুভমেন্টের জন্য কোনো বাস্তবিক কারণ ছিল না। যুক্তরাজ্যে কোনো উল্লেখযোগ্য ইভেন্ট
বৃহস্পতিবারের ট্রেডের বিশ্লেষণ EUR/USD পেয়ারের 1H চার্ট বৃহস্পতিবার EUR/USD কারেন্সি পেয়ারের মূল্যের সামান্য ঊর্ধ্বমুখী প্রবণতা দেখা গেছে, যদিও দিনের দ্বিতীয়ার্ধে দরপতন দেখা দিলে সেটি আরও যৌক্তিক হতো। দিনের প্রথমার্ধে কোনো
বুধবারের ট্রেডের বিশ্লেষণ GBP/USD পেয়ারের 1H চার্ট বুধবার GBP/USD পেয়ারের মূল্যের মুভমেন্ট ও EUR/USD পেয়ারের মূল্যের মুভমেন্টের সাথে ঘনিষ্ঠভাবে সাদৃশ্যপূর্ণ ছিল, যা আরও এই বিষয়টি নিশ্চিত করেছে যে বর্তমান পরিস্থিতি
বুধবারের ট্রেডের বিশ্লেষণ EUR/USD পেয়ারের 1H চার্ট বুধবার EUR/USD কারেন্সি পেয়ারের মূল্যের মিশ্র মুভমেন্ট দেখা গেছে। দিনের বেলা মূল্য কয়েকবার দিক পরিবর্তন করেছে, তবে এই রিভার্সালগুলো কোনো সামষ্টিক অর্থনৈতিক প্রতিবেদনের
মঙ্গলবারের ট্রেডের বিশ্লেষণ GBP/USD পেয়ারের 1H চার্ট মঙ্গলবার GBP/USD পেয়ারের উল্লেখযোগ্য দরপতন হয়েছে। যদিও পাউন্ডের এই দরপতন কিছুটা ধীরগতিতে শুরু হয়েছিল, সন্ধ্যায় ডোনাল্ড ট্রাম্প অবশেষে ডলারের মূল্য ঊর্ধ্বমুখী করার সিদ্ধান্ত
মঙ্গলবারের ট্রেডের বিশ্লেষণ EUR/USD পেয়ারের 1H চার্ট মঙ্গলবার EUR/USD কারেন্সি পেয়ারের তুলনামূলকভাবে উল্লেখযোগ্য দরপতন দেখা গেছে। প্রায় সারা দিনজুড়ে ইউরোর দরপতন হয়েছে, এবং রাতারাতি এই মুভমেন্ট আরও তীব্র হয়েছে। নতুন
সোমবারের ট্রেডের বিশ্লেষণ GBP/USD পেয়ারের 1H চার্ট সোমবার পুরো দিনজুড়ে GBP/USD পেয়ারের মূল্যের শক্তিশালী ঊর্ধ্বমুখী মুভমেন্ট বজায় ছিল। সপ্তাহের প্রথম দিনের ট্রেডিংয়ে যুক্তরাজ্য বা যুক্তরাষ্ট্র—কোনো দেশ থেকেই উল্লেখযোগ্য কোনো ইভেন্ট
সোমবারের ট্রেডের বিশ্লেষণ EUR/USD পেয়ারের 1H চার্ট সোমবার EUR/USD কারেন্সি পেয়ারের মূল্যের তীব্র ঊর্ধ্বমুখী প্রবণতার সাথে ট্রেডিং শুরু হয়েছে। রাতারাতি ইউরোর মূল্য 100–120 পিপস পর্যন্ত বৃদ্ধি পেয়েছে, এবং দিনের বাকি
শুক্রবারের ট্রেডের বিশ্লেষণ GBP/USD পেয়ারের 1H চার্ট শুক্রবার GBP/USD পেয়ারের মূল্যের অস্থিরতার মাত্রা ছিল অত্যন্ত কম, তবে এর মধ্যেও ব্রিটিশ পাউন্ডের মূল্য ধীরে ধীরে ঊর্ধ্বমুখী হতে থাকে। আসলে, গত সপ্তাহে
শুক্রবারের ট্রেডের বিশ্লেষণ EUR/USD পেয়ারের 1H চার্ট গত শুক্রবার EUR/USD কারেন্সি পেয়ারের মূল্যের কোনো মুভমেন্টই দেখা যায়নি। সেদিন ছিল গুড ফ্রাইডে, এবং এর পরে ছিল ইস্টার সানডে। ফলে অনেক দেশেই
Forex Chart
Web-version

Your IP address shows that you are currently located in the USA. If you are a resident of the United States, you are prohibited from using the services of InstaFintech Group including online trading, online transfers, deposit/withdrawal of funds, etc.
If you think you are seeing this message by mistake and your location is not the US, kindly proceed to the website. Otherwise, you must leave the website in order to comply with government restrictions.
Why does your IP address show your location as the USA?
Please confirm whether you are a US resident or not by clicking the relevant button below. If you choose the wrong option, being a US resident, you will not be able to open an account with InstaTrade anyway.
We are sorry for any inconvenience caused by this message.


