النماذج الفعلية

النماذج هي نماذج رسومية تتشكل في الرسم البياني حسب السعر. وفقا لأحد المسلمات التحليلية الفنية، فإن التاريخ (حركة السعر) يكرر نفسه. ويعني ذلك أن حركات الأسعار غالباً ما تكون متشابهة في نفس الأوضاع مما يجعل من الممكن التنبؤ بزيادة تطوير الوضع الذي يتسم باحتمال كبير.
النماذج ذات الصلة المقدمة من قبل إنستافوركس هي خدمة سهلة الاستخدام تسمح لك بمعرفة التغييرات الأخيرة في السوق والرد على الأدلة من السوق في الوقت المناسب. في خدمتنا، ستجد دائمًا النماذج الأكثر حداثة وملاءمة في أي زوج وأي إطار زمني.
Bullish Rectangle
was formed on 26.03 at 14:44:13 (UTC+0)
signal strength 3 of 5
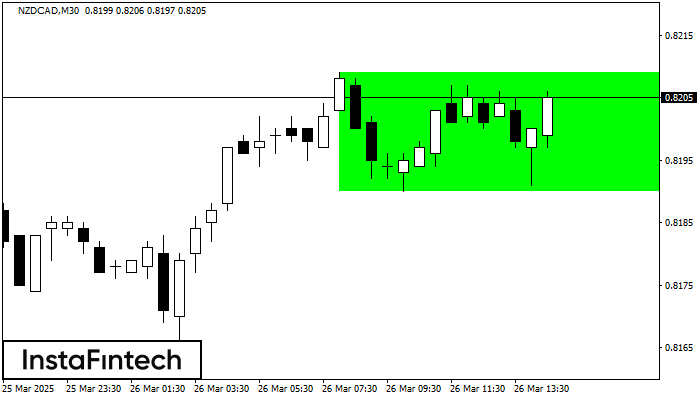
According to the chart of M30, NZDCAD formed the Bullish Rectangle which is a pattern of a trend continuation. The pattern is contained within the following borders: the lower border 0.8190 – 0.8190 and upper border 0.8209 – 0.8209. In case the upper border is broken, the instrument is likely to follow the upward trend.
انظر أيضا
- All
- All
- Bearish Rectangle
- Bearish Symmetrical Triangle
- Bearish Symmetrical Triangle
- Bullish Rectangle
- Double Top
- Double Top
- Triple Bottom
- Triple Bottom
- Triple Top
- Triple Top
- All
- All
- Buy
- Sale
- All
- 1
- 2
- 3
- 4
- 5
Fundo duplo
was formed on 10.04 at 23:00:28 (UTC+0)
signal strength 1 of 5
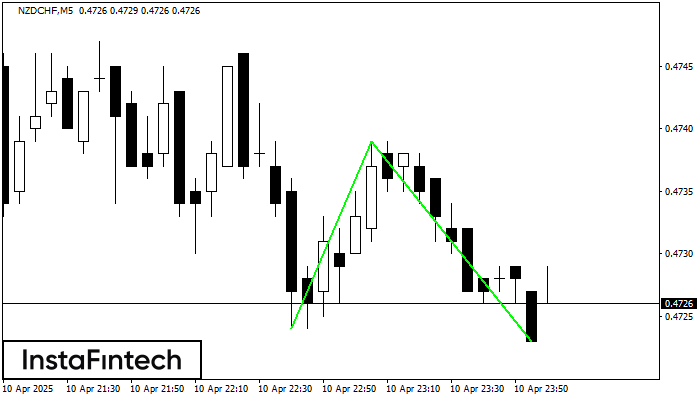
O padrão Fundo duplo foi formado em NZDCHF M5. Características: o nível de suporte 0.4724; o nível de resistência 0.4739; a largura do padrão 15 pontos. Se o nível
Os intervalos M5 e M15 podem ter mais pontos de entrada falsos.
Open chart in a new window
Triângulo Simétrico de Baixa
was formed on 10.04 at 22:58:48 (UTC+0)
signal strength 1 of 5
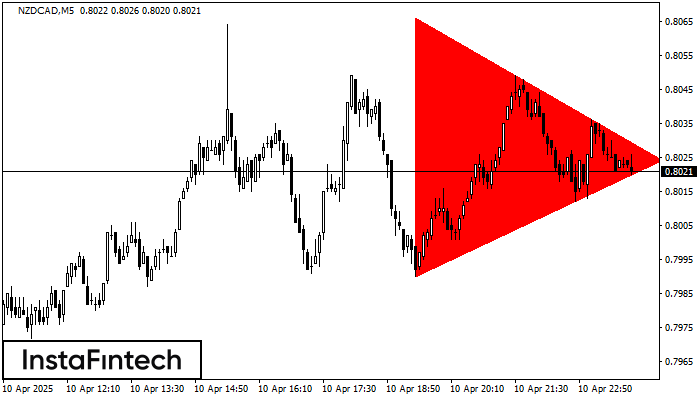
De acordo com o gráfico de M5, NZDCAD fomrou o padrão de Triângulo Simétrico de Baixa. Este padrão sinaliza uma nova tendência de baixa se o limite inferior 0.7990
Os intervalos M5 e M15 podem ter mais pontos de entrada falsos.
Open chart in a new window
Retângulo de alta
was formed on 10.04 at 22:51:41 (UTC+0)
signal strength 1 of 5
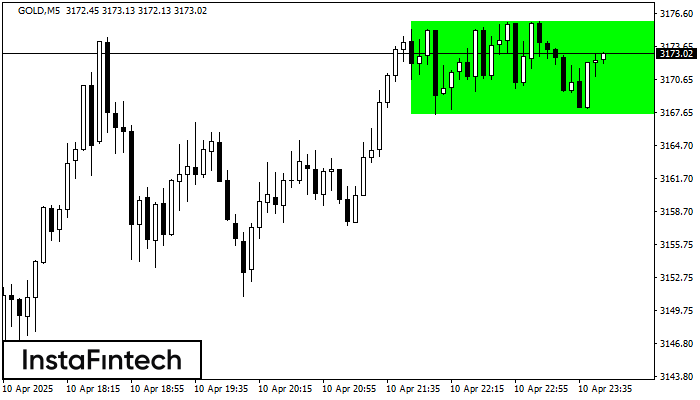
Conforme o gráfico de M5, GOLD formou o Retângulo de alta. Este tipo de padrão indica uma continuação da tendência. Ele consiste em dois níveis: resistência 3175.88 e suporte 3167.51
Os intervalos M5 e M15 podem ter mais pontos de entrada falsos.
Open chart in a new window