النماذج الفعلية

النماذج هي نماذج رسومية تتشكل في الرسم البياني حسب السعر. وفقا لأحد المسلمات التحليلية الفنية، فإن التاريخ (حركة السعر) يكرر نفسه. ويعني ذلك أن حركات الأسعار غالباً ما تكون متشابهة في نفس الأوضاع مما يجعل من الممكن التنبؤ بزيادة تطوير الوضع الذي يتسم باحتمال كبير.
النماذج ذات الصلة المقدمة من قبل إنستافوركس هي خدمة سهلة الاستخدام تسمح لك بمعرفة التغييرات الأخيرة في السوق والرد على الأدلة من السوق في الوقت المناسب. في خدمتنا، ستجد دائمًا النماذج الأكثر حداثة وملاءمة في أي زوج وأي إطار زمني.
Actual Patterns
- All
- All
- Bearish Rectangle
- Bearish Symmetrical Triangle
- Bearish Symmetrical Triangle
- Bullish Rectangle
- Double Top
- Double Top
- Triple Bottom
- Triple Bottom
- Triple Top
- Triple Top
- All
- All
- Buy
- Sale
- All
- 1
- 2
- 3
- 4
- 5
Bearish pennant
was formed on 16.04 at 16:00:14 (UTC+0)
signal strength 1 of 5
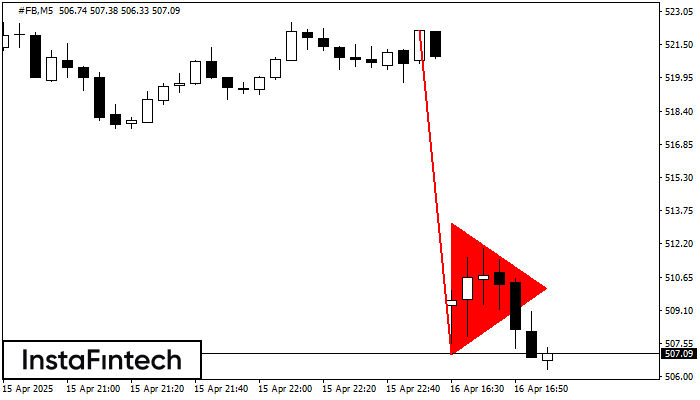
The Bearish pennant pattern has formed on the #FB M5 chart. The pattern signals continuation of the downtrend in case the pennant’s low of 507.03 is broken through. Recommendations: Place
The M5 and M15 time frames may have more false entry points.
Open chart in a new window
Bearish Rectangle
was formed on 16.04 at 15:55:38 (UTC+0)
signal strength 1 of 5
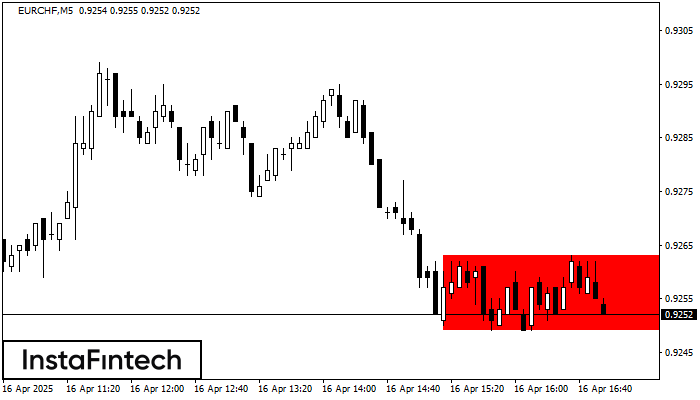
According to the chart of M5, EURCHF formed the Bearish Rectangle. This type of a pattern indicates a trend continuation. It consists of two levels: resistance 0.9263 - 0.0000
The M5 and M15 time frames may have more false entry points.
Open chart in a new window
Head and Shoulders
was formed on 16.04 at 15:30:49 (UTC+0)
signal strength 2 of 5
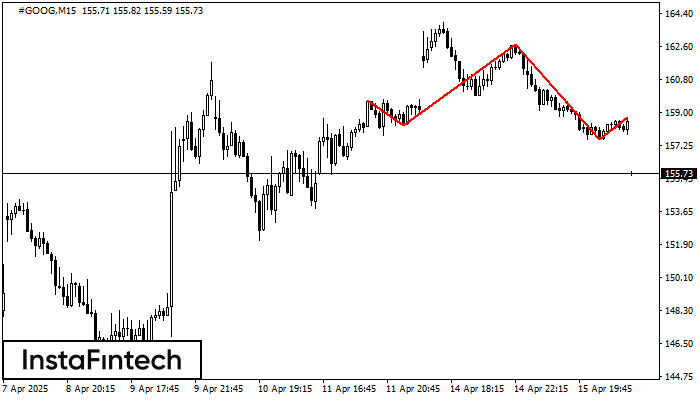
According to the chart of M15, #GOOG formed the Head and Shoulders pattern. The Head’s top is set at 162.70 while the median line of the Neck is found
The M5 and M15 time frames may have more false entry points.
Open chart in a new window
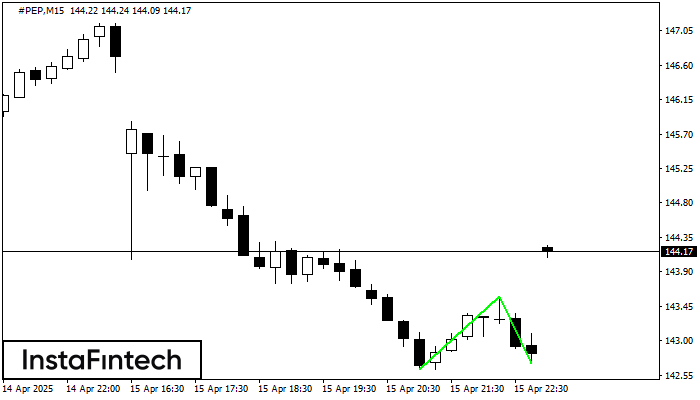
Double Bottom
was formed on 16.04 at 15:30:39 (UTC+0)
signal strength 2 of 5

The Double Bottom pattern has been formed on #PEP M15; the upper boundary is 143.58; the lower boundary is 142.70. The width of the pattern is 96 points. In case
The M5 and M15 time frames may have more false entry points.
Open chart in a new window
Double Bottom
was formed on 16.04 at 15:30:27 (UTC+0)
signal strength 2 of 5
The Double Bottom pattern has been formed on #PEP M15. Characteristics: the support level 142.62; the resistance level 143.58; the width of the pattern 96 points. If the resistance level
The M5 and M15 time frames may have more false entry points.
Open chart in a new window
Head and Shoulders
was formed on 16.04 at 15:00:08 (UTC+0)
signal strength 2 of 5
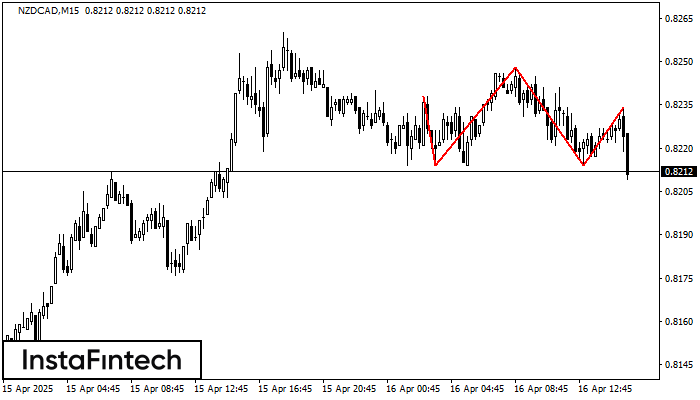
The NZDCAD M15 formed the Head and Shoulders pattern with the following features: The Head’s top is at 0.8248, the Neckline and the upward angle are at 0.8214/0.8214. The formation
The M5 and M15 time frames may have more false entry points.
Open chart in a new window
Bullish Rectangle
was formed on 16.04 at 14:30:25 (UTC+0)
signal strength 2 of 5
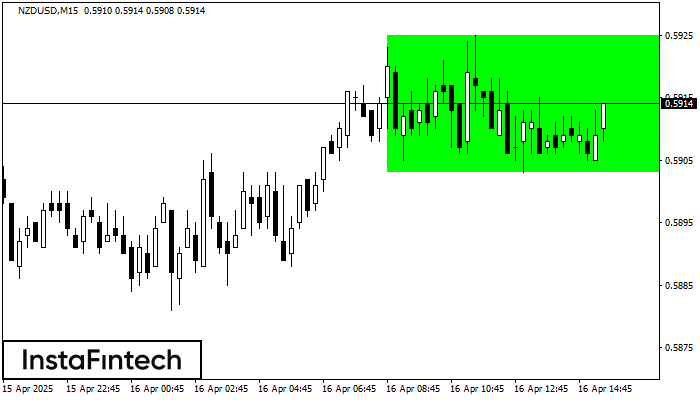
According to the chart of M15, NZDUSD formed the Bullish Rectangle which is a pattern of a trend continuation. The pattern is contained within the following borders: the lower border
The M5 and M15 time frames may have more false entry points.
Open chart in a new window
Bearish Rectangle
was formed on 16.04 at 14:05:33 (UTC+0)
signal strength 1 of 5
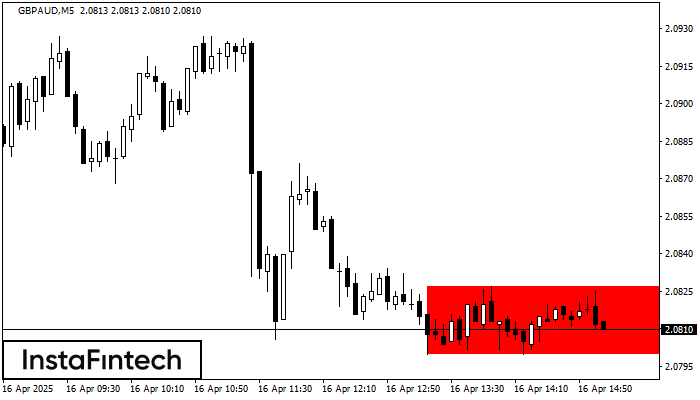
According to the chart of M5, GBPAUD formed the Bearish Rectangle. This type of a pattern indicates a trend continuation. It consists of two levels: resistance 2.0827 - 0.0000
The M5 and M15 time frames may have more false entry points.
Open chart in a new window
Triple Top
was formed on 16.04 at 13:40:08 (UTC+0)
signal strength 1 of 5
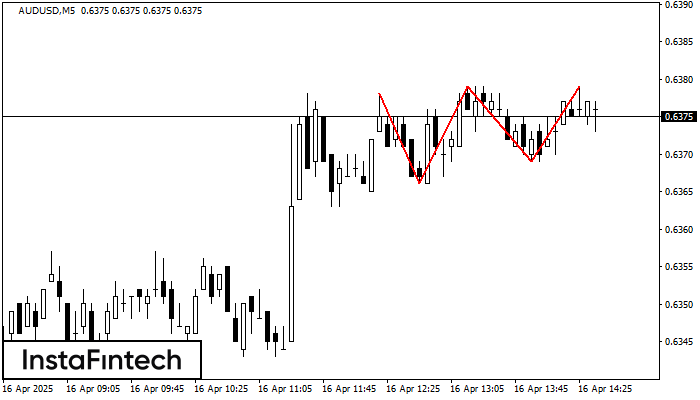
On the chart of the AUDUSD M5 trading instrument, the Triple Top pattern that signals a trend change has formed. It is possible that after formation of the third peak
The M5 and M15 time frames may have more false entry points.
Open chart in a new window